Stat4603/5504-Assignment3
Total marks: 100
代写统计课业作业 1.[10 marks]Fit a seasonal ARIMA model of your choice to the monthly unemployment data in unemp Go through the diagnostic checking and use
1.[10 marks]
Fit a seasonal ARIMA model of your choice to the monthly unemployment data in unemp Go through the diagnostic checking and use the model to forecast the next 12 months.
2.[10 marks]
Fit a seasonal ARIMA model of your choice to Johnson and Johnson jj quarterly earnings. Remove the last four quarters from your data before fitting the model. Forecast these quarters. Compare forecasts and actual values.
3.Lagged regression with dependent errors 代写统计课业作业
Let Strepresent the monthly sales data in sales file (n = 150) and let Ltbe the leading indicator data in lead file.
(a) [10 marks] Fit an ARIMA model to St . Discuss your model fitting in a step-by-step fashion, presenting your (A) initial examination of the data, (B) transformation if necessary, (C) initial identification of the dependence orders and degree of differencing, (D) parameter estimation, (E) residual diagnostics, and model choice.
(b) [5 marks] Use CCF and lags plots between ∆St and ∆Lt to argue that a regression of ∆St on ∆Lt−3 is reasonable. [Note that in lag2.plot(x, y), the first series x gets lagged].
(c) [10 marks] Fit a regression model ∆St = β0 + β1∆Lt−3 + zt where zt is an ARMA process. (Explain how you decided on your model for zt).
4.[5 marks] Delayed signal 代写统计课业作业
In applications, we will often observe series containing a signal that has been delayed by some unknown time D, i.e.
xt = st + Ast−D + nt,
where st and nt are stationary and independent with zero mean and spectral densities fs and fn, respectively.The delayed signal gets multiplied by unknown constant A. Show that
fx(ω) = [1 + A2 + 2A cos(2πωD)]fs(ω) + fn(ω).
5.[5 marks] Cycles in chicken price
Analyse the chicken price data chicken using frequency-domain approach. What are the interesting cycles that can be discovered? (there is one obvious. To what does it correspond?)
6.Salt concentration levels 代写统计课业作业
The levels of salt concentration known to have occurred over rows, corresponding to the average temperature levels are in salt and saltemp.
(a) [5 marks] Plot the two series and then identify the dominant frequencies by performing separate spectral analyses on the two series. Interpret your findings.
(b) [5 marks] Analyse the coherence between the temperature and salt data. Discuss your findings.
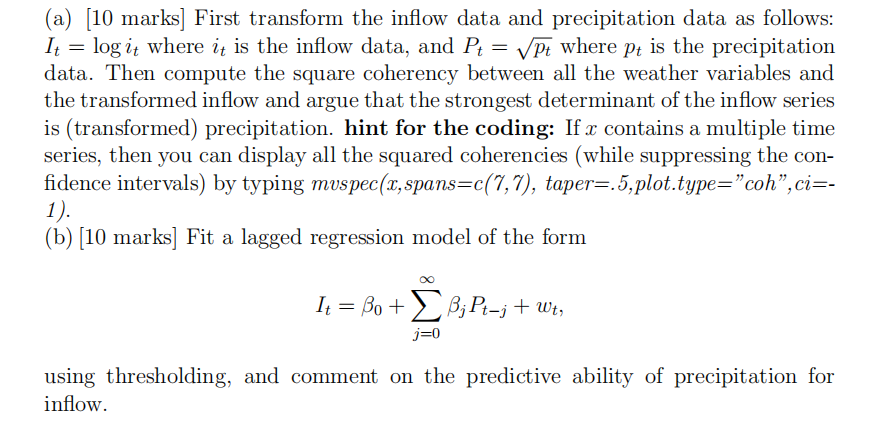
7.Frequency analysis of weather factors 代写统计课业作业
The data set climhyd contains 454 months of measured values for six climatic variables: (i) air temperature Temp, (ii) dew point DewPt, Cloud cover CldCvr, (iv) wind speed WndSpd, (v) precipitation Precip, and (vi) inflow Inflow, at Lake Shasta in California. We would like to look into possible relations among the weather factors and between the weather factors and the inflow to Lake Shasta.
8.[5 marks]
Plot GNP (Global National Product) data gnp, and then test for a unit root against the alternative that the process is explosive (random walk).
9.[10 marks] 代写统计课业作业
The stats package of R contains the daily closing prices of four major European stock markets; (type help(EustockMarkets)) for details. Fit a GARCH model to the returns of one of these series and discuss your findings. Note: These are actual values, and not returns. Hence data must be transformed prior to the modelling.